2(e) plot and interpret speed-time and distance-time graphs.
2(f) recognize from the shape of a speed-time graph when a body is
(1) at rest,
(2) moving with uniform speed,
(3) moving with uniform acceleration,
(4) moving with non-uniform acceleration.
Speed Time Graphs
Plotting a graph is simple enough. In a speed-time graph, the speed (m/s) is always on the vertical axis, that is the y axis. The time (s) is on the horizontal axis, that is the x axis. Head over here if you need more tips in making a graph.
There are a few things you need to remember for a speed time graph. When an object is
(1) At Rest
The graph would be like this.

This is so because the speed of the object is zero, as the red line shows in the graph above. As a result, there is no movement and the body is at rest.
(2) Moving with uniform speed
If the line is vertical like this;

the speed of the object is constant. This is so because there is no increase in the vertical axis, meaning there is no increase in the speed of the object. This also means that there is no acceleration, as there is no increase in the velocity of the object.
(3) Moving with uniform acceleration and deceleration
Now if the graph is sloping like this
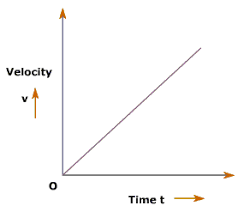 It means that the velocity of the object is increasing, and it is accelerating, as there is a change in velocity. As the acceleration is uniform, it can be easily calculated by the acceleration formula; final velocity- initial velocity/time taken. This can be done by taking two points on the graph, and applying the formula.

In this graph, the velocity is decreasing. Thus the object is decelerating too.
(4) Moving with non uniform acceleration and deceleration.
When the velocity of an object is increasing or decreasing non uniformly, that is at changing rates, then the object accelerates or decelerates non uniformly. As the graph below shows, in both the cases, the acceleration is non uniform, as the velocity of the object changes non uniformly i-e not at a constant rate.

Distance time graph.
The plotting is the same as the speed-time graph. The distance (m) is one the y axis and time (s) on the x axis. There are some differences though. First of all, if the distance-time graph is a straight horizontal line like this.

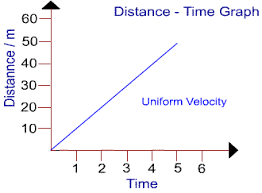
In the above graph, we can see that the object is covering distance at a constant rate. It has covered a distance of 10m in 1s, 20m in 2s and so on. By this constant gradient of the line, we can deduce that the speed of the object is constant too. We can say that in a distance time graph, the gradient of the line is the speed of the object. And in the above graph, the gradient is constant, so the speed is constant too.
2(f) recognize from the shape of a speed-time graph when a body is
(1) at rest,
(2) moving with uniform speed,
(3) moving with uniform acceleration,
(4) moving with non-uniform acceleration.
Speed Time Graphs
Plotting a graph is simple enough. In a speed-time graph, the speed (m/s) is always on the vertical axis, that is the y axis. The time (s) is on the horizontal axis, that is the x axis. Head over here if you need more tips in making a graph.
There are a few things you need to remember for a speed time graph. When an object is
(1) At Rest
The graph would be like this.
This is so because the speed of the object is zero, as the red line shows in the graph above. As a result, there is no movement and the body is at rest.
(2) Moving with uniform speed
If the line is vertical like this;
(3) Moving with uniform acceleration and deceleration
Now if the graph is sloping like this
In this graph, the velocity is decreasing. Thus the object is decelerating too.
(4) Moving with non uniform acceleration and deceleration.
When the velocity of an object is increasing or decreasing non uniformly, that is at changing rates, then the object accelerates or decelerates non uniformly. As the graph below shows, in both the cases, the acceleration is non uniform, as the velocity of the object changes non uniformly i-e not at a constant rate.
Distance time graph.
The plotting is the same as the speed-time graph. The distance (m) is one the y axis and time (s) on the x axis. There are some differences though. First of all, if the distance-time graph is a straight horizontal line like this.
then the object is stationary. This is so because there is no change in the y axis, meaning the object is not covering any distance. This means that the speed of the object is 0 too.
really helpful........thanks
ReplyDeleteIt helped me
ReplyDeleteSo helpful thanks
ReplyDeletethanks for help
ReplyDeleteTHanks
ReplyDeletereally helpful
ReplyDeleteThx reviewing the whole of Physics IGCSE again, exam coming this May (sadface)
ReplyDeletethis site is really cooooll....! it was really helpful for me
ReplyDelete